


Advancing IDEAL-CT with Camera Analysis
- August 26th, 2026
- Category: Guest Posts, News & Events
This guest post was written by Andrew B. Cooper.
AI is now part of everyday life, whether we notice it or not. Cameras help us drive cars and trucks, recognize our faces on our phones or at airports, improve X-ray analysis, and keep manufacturing lines running. Construction materials labs are not known for adopting new technology early, but forward-thinking labs can see what the same combination of cameras and software can bring to materials testing.
We use Balanced Mix Design (BMD) tests such as IDEAL-CT because they are quick and simple to run. The equipment is reliable, and the index is easy to understand. Asking a lab to change test methods or add yet another performance test means more equipment, more specimen preparation, more technician time, and more expense. Cameras and AI allow us to be smarter by asking how much more information we can obtain from the tests labs already perform.
Of all civil engineering materials tests, I think IDEAL-CT is the best for cameras and AI. Concrete fractures too quickly, and even if filmed, it might not tell us so much. In binder and aggregate tests, the specimens are generally hidden from view.
IDEAL-CT is almost made for camera analysis. Both faces of the specimen are fully visible as they deform and crack over the course of 10 to 15 seconds. There is time to record where movement begins, how deformation develops, how cracks form and grow, and how the two faces differ. Yet the standard test reduces this entire event to a load curve and then to a single index. That index does not tell us how the specimen failed or to what extent the cracks on the two faces differed.
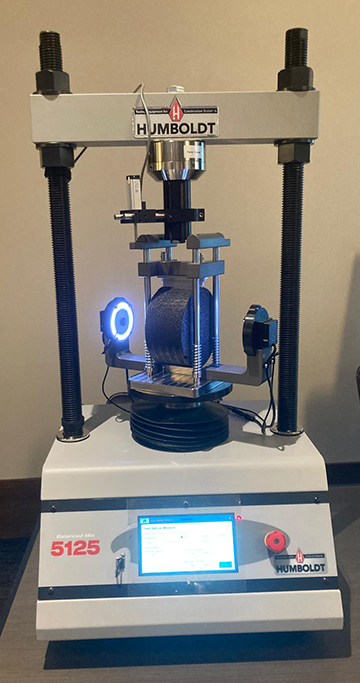
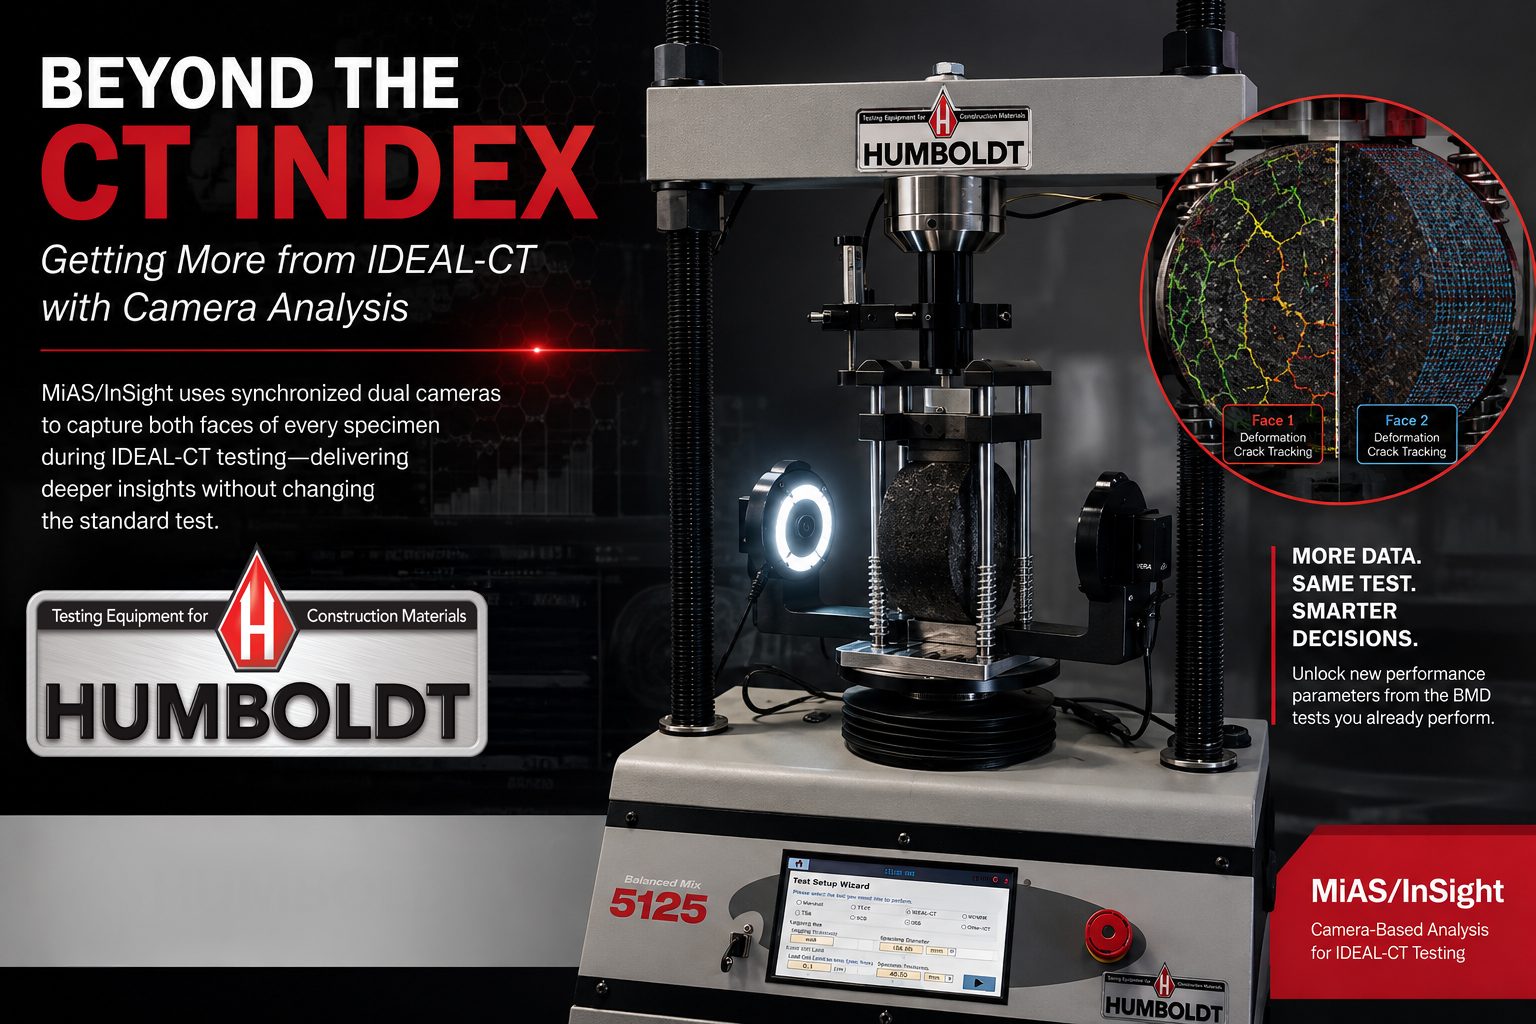
The MiAS/InSight jig fits into a standard Humboldt load frame. Two synchronized cameras with built-in LED lights face the specimen and record both sides during every BMD test. No painting, speckling, or other specimen preparation is required. Nothing changes about the specimen or the test procedure. The standard CT Index is still produced.
In addition to the CT Index, the cameras provide:
- Specimen positioning. The images show whether the specimen was centered and seated correctly in the load frame. Off-center positioning affects the CT Index, but the standard result does not flag it.
- Face-to-face comparison. A ratio shows the difference in deformation and cracking between the two faces. Large differences flag a lack of uniformity through the specimen and can indicate a density gradient.
- Machine and process monitoring. Every test records how machine movement compares with specimen movement. Changes in this relationship expose changes in test behavior between annual calibrations.
- A permanent record of both faces. Video of both sides of every specimen is saved. It can be reviewed if a result is disputed, used for QC/QA, and analyzed again as the software improves.
These QC/QA benefits matter, but the bigger opportunity is the development of new performance parameters.
IDEAL-CT is popular because it is easy to run, but the CT Index is not a pure measure of cracking. Anyone who watches the test can see why. Wedges form at the loading strips and push into the specimen. Cracks also form in the center and eventually join the wedges. Several types of movement and cracking happen at the same time. This is mixed-mode failure.
The load curve combines everything into a single output. It cannot separate the different parts of the failure, even though each part contains information about the mix.
Camera analysis can separate movement at the loading strips from cracking in the center. It can also measure speed, timing, and differences between the two faces. This gives us far more information from the same simple test while keeping the CT Index.
Current work suggests that a single IDEAL-CT test contains signals related to rutting, modulus, and recovered-binder properties. Instead of preparing another specimen and running another test, cameras and AI allow us to obtain more information from the tests labs already perform.
Cars with cameras may eventually achieve full self-driving. For now, we still drive them while the software learns from the camera data and gives us more help. BMD testing can follow the same path.
Camera-based outputs will probably replace indexes based on the load curve alone. Until we have the confidence to make that change, the familiar CT Index stays in place. The cameras give us more from every test today, and even more as the software improves.
This is not another BMD test. It is a way to keep improving the BMD tests we already run.